What Is the Zone System?
The Zone System is a systematic method for controlling tonal values in a photograph from exposure through development to final print, developed by Ansel Adams and Fred Archer at the Art Center School in Los Angeles
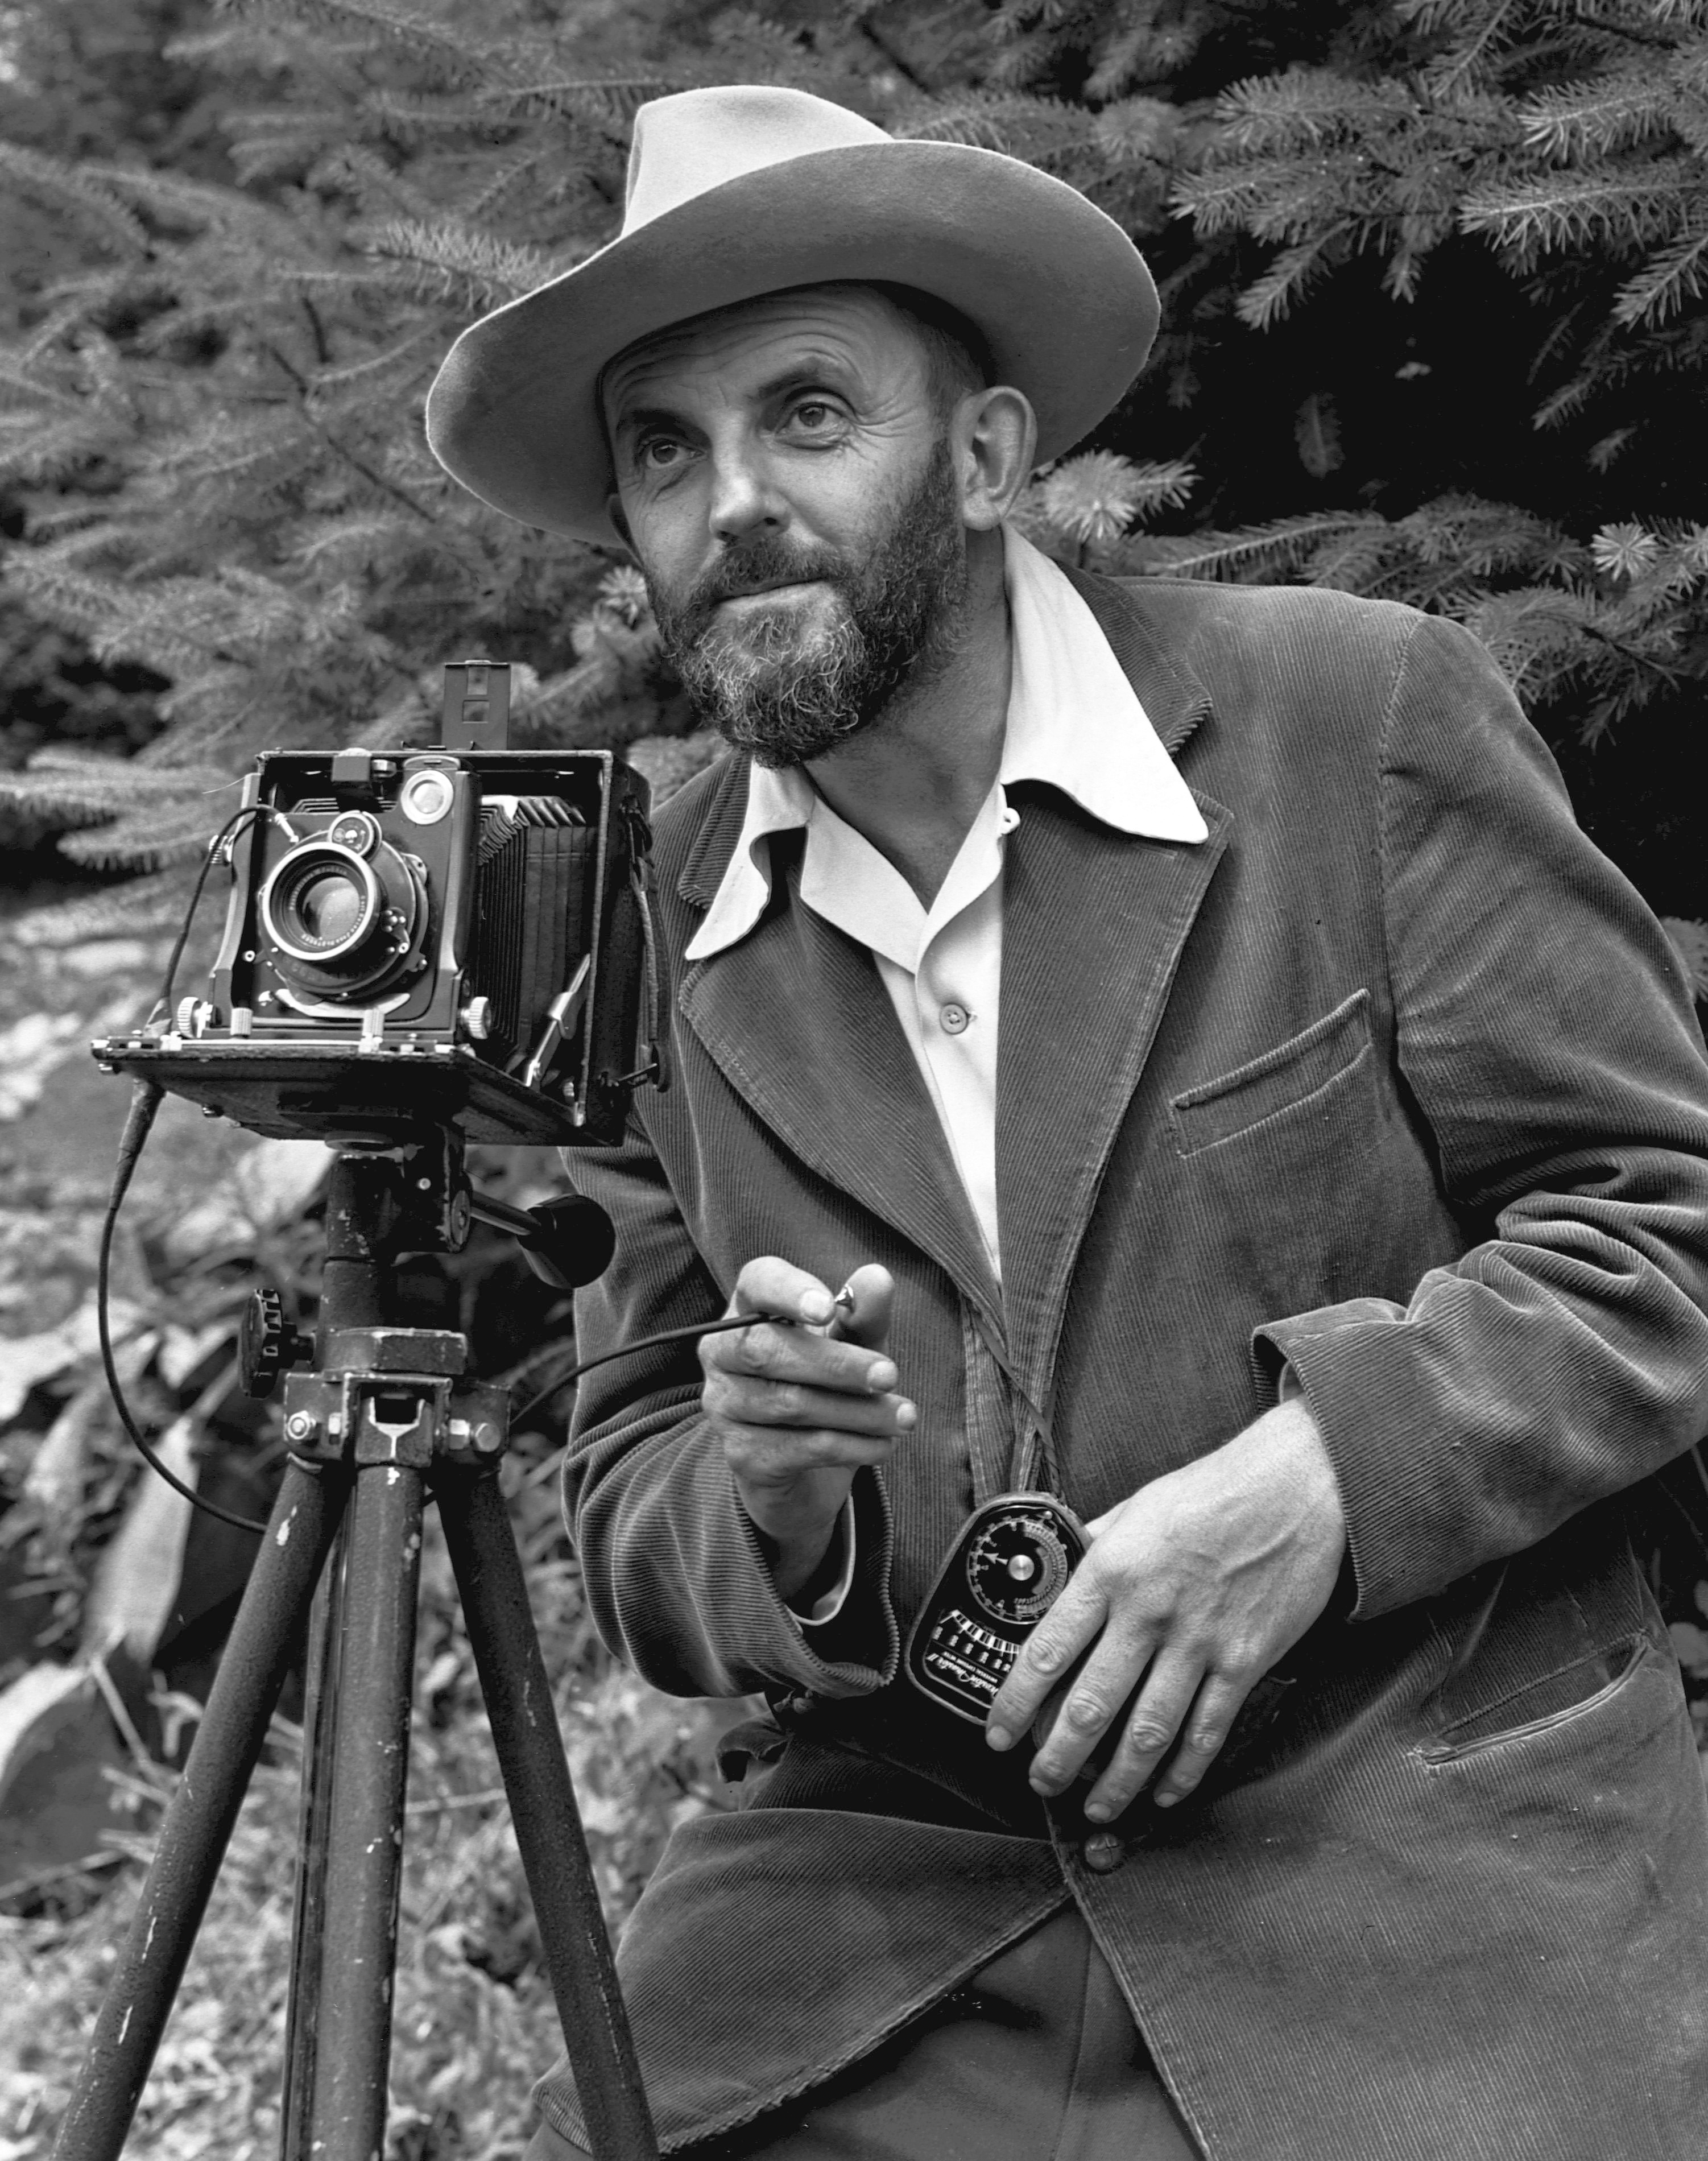
between 1939 and 1940.[1] Adams codified the system across his three-volume technical trilogy — The Camera, The Negative, and The Print[2] — and taught it for four decades through his Yosemite workshops.
The system connects three measurable quantities:
- Brightness — what you see in the scene (luminance, measured in stops)
- Density — what the film records (controlled by exposure + development)
- Tonal value — what the viewer sees in the final print (controlled by paper grade + printing exposure)
By assigning each part of the scene to a numbered zone before pressing the shutter, you predict exactly how the print will look. This is what Adams called pre-visualization — the disciplined imagining of the final print at the moment of exposure.
The Ansel Adams Zone Chart
The Ansel Adams Zone Chart (also called the Zone System Chart or simply the Zone Chart) is the central reference for the Zone System. It divides the tonal range a B&W print can reproduce into 11 zones, numbered with Roman numerals 0 through X, where each zone is one stop of light from its neighbour. The Zone Chart is what the photographer reads when planning an exposure, and what the printer reads when judging a final print — the same chart used at both ends of the workflow.
Adams' original chart, reproduced widely in The Negative and the broader Zone System literature, lists each zone with its print value (from pure black to pure white) and the kind of subject typically placed there. The version below mirrors that canonical chart with modern subject examples.
| Zone | Tone | Print value | Typical subject |
|---|---|---|---|
| 0 | Pure black | No detail | Solid shadow, blackest paper black |
| I | Near black | Faintest tonality | Threshold of detail |
| II | Very dark | Suggestion of texture | Deepest shadows where you want detail to show |
| III | Dark | Full texture | Dark shadows with detail (foliage shadows, dark fabric) |
| IV | Dark mid-tone | Texture clear | Dark hair, shadow side of face |
| V | Middle gray | 18% gray | Reflected meter reading; standard gray card |
| VI | Light mid-tone | Texture distinct | Caucasian skin in sun, light foliage |
| VII | Light | Full texture | Light skin, bright concrete, snow in shadow |
| VIII | Very light | Delicate texture | Highlights with just-visible detail |
| IX | Near white | Faintest tonality | Just below paper-base white |
| X | Pure white | No detail | Specular highlights, blank paper |
At a glance: the Zone Chart anchors three reference points the photographer uses repeatedly. Zone V is middle gray — what any reflected light meter reads when pointed at a scene. Zone III is the deepest shadow that should still show full texture in the print. Zone VII is the brightest highlight that should still show full texture. Everything else is positioned relative to these three anchors. Memorising Zones III, V, and VII is enough to start applying the Zone System; the rest of the chart is the printable consequence of those three anchor placements.
Zones III and VII are the textural anchors — the darkest shadow and brightest highlight where the print should still show full detail. Zone V is the meter's reference point: any reflected reading places that subject on Zone V unless you compensate.
Pre-Visualization: The Core Discipline
Before pressing the shutter, decide where each important part of the scene should land in the final print. This is the irreducible Zone System practice — without pre-visualization, the rest of the system collapses into a calibration exercise. Adams put it bluntly: "Visualization is, in fact, the conscious process of projecting the final photographic image in the mind before taking the first steps in actually photographing the subject."[1]
Pre-visualization forces you to commit to an interpretation of the scene before the technical work begins. Are the shadows going to be Zone II (mood, texture loss) or Zone III (clear detail)? Is bright snow going to be Zone VIII (delicate texture) or Zone IX (luminous, detail-free)?
Exposure Places, Development Controls
The most important operational rule of the Zone System:
Exposure controls shadow density. Development controls highlight density.
This is not a rule of thumb — it's a statement about the shape of the film's characteristic curve.

The toe of the curve (low-density region where shadows record) is fixed by total exposure; you cannot lift dark zones without giving more light. The shoulder of the curve (high-density region where highlights record) is shaped by development time; longer development extends highlights upward, shorter development compresses them.
Practical consequences:
- To move shadows to a higher zone (recover detail): give more exposure
- To compress highlights to a lower zone (recover detail in bright areas): reduce development (N- processing)
- To expand highlights to a higher zone (boost contrast): increase development (N+ processing)
N+/N- Development Adjustments
| Adjustment | Time change | Use case |
|---|---|---|
| N (Normal) | Standard time | 7-stop scene → grade 2 paper |
| N+1 | +20-30% | Compress 6-stop scene to fill the 7-stop negative range |
| N+2 | +50% | Expand 5-stop flat scene |
| N-1 | -15-20% | Compress 8-stop scene; recover bright highlights |
| N-2 | -30-40% | Compress 9-stop high-contrast scene |
Adams favored sheet film for Zone System work precisely because each sheet could be developed individually — different N values for different scenes shot the same day. With roll film, you must commit to one N value per roll, which limits how aggressively you can apply the system in mixed lighting.
Practical Application — Step by Step
- Meter the darkest shadow where you want detail with a spot meter or careful approximation
- Meter the brightest highlight where you want detail
- Count the stops between them:
- 7 stops → Normal development
- 6 stops → N+1
- 5 stops → N+2
- 8 stops → N-1
- 9+ stops → N-2 or paper-grade compensation
- Place the shadow on Zone III: the meter reading puts the subject on Zone V; stop down 2 stops to drop it to Zone III
- Verify the highlight lands at Zone VII (or wherever you've planned). If it lands higher, plan N- compensation
- Develop accordingly and trust the chart
Adams in Practice — Iconic Examples
Moonrise, Hernandez, New Mexico (1941) is Adams' most-reproduced Zone System example.

The original negative was difficult — the moon was Zone VIII, the foreground crosses were Zone III, and the sky between was a flat Zone V. Adams' final print uses N+1 development to expand the brightness range, plus extensive printing manipulation to dodge the foreground and burn the sky. The result preserves both shadow detail in the foreground and the moon's luminosity.
Clearing Winter Storm, Yosemite Valley (c. 1937) required Zone System discipline to handle the extreme range between snow-covered peaks (Zone VIII-IX) and forested valley shadows (Zone II-III). Adams used careful spot metering, planned N-1 development, and burned the highlights aggressively in the print.
These workflow examples appear throughout The Negative — the book is essentially a sequence of Zone System case studies, each working through pre-visualization → metering → exposure → development → printing for a real scene.
Modern Adaptations
Roll film
With roll film you cannot vary development per-frame. The pragmatic adaptation: shoot at the box speed and meter for shadows on Zone III, then commit to Normal development for the whole roll. Reserve N+/N- variations for situations where you can dedicate an entire roll to one lighting condition.
Digital sensors
Modern digital sensors have ~14 stops of dynamic range — almost double a film negative — and the highlight rolloff is software-controlled. Zone System pre-visualization remains useful for planning, but the development half of the system is replaced by RAW conversion curves. The "Zone V is the meter reading" anchor still holds; the "exposure controls shadows, development controls highlights" rule becomes "ETTR (expose to the right) protects shadow detail, RAW curves shape highlight detail."
Spot metering
Adams used reflected meters and the Zone System to compensate for their averaging behavior. Modern matrix-metering cameras already do scene-aware compensation, but a spot meter remains the right tool for serious Zone System work — it lets you meter individual zones rather than guessing at scene averages.
Tips for Self-Calibration
- Calibrate your personal system: your meter, your film, your developer, your enlarger. Published Zone System data is a starting point, not gospel — every photographer's combination of equipment yields slightly different zone placements.
- The Zone System is a framework, not a rigid formula. Even a partial understanding (just spot-metering the shadow and placing it on Zone III) improves any photographer's exposure decisions.
- Read the trilogy in order: The Camera (gear), The Negative (Zone System core, exposure + development), The Print (Zone System completion, paper + printing manipulation). Each builds on the previous.[2]
- Workshops compound the books: The system is much easier to absorb hands-on with a teacher than from text. The Ansel Adams Gallery and several US workshop programs continue Adams' teaching tradition.
See Also
- Characteristic curve (sensitometry — H&D curve theory underlying the Zone System; covered inline in the "Exposure Places, Development Controls" section above).
- Spot metering (the metering tool the Zone System assumes — single-area reflected light measurement, not scene-averaging).